
The working journal / Inside the implementation
Making this journal faster without stripping out the design
How we reduced the Blutek homepage's measured mobile LCP from 2.6 seconds to about 1.4 seconds through image sizing, HTTP/2, compression, and caching, without replacing the design.
The easy version of a performance project is to remove everything interesting from the page. Fewer images, less type, a smaller header. That may reduce what a browser downloads, but it also changes the product.
For the Blutek Media journal, the brief was different. Keep the full-width navy header, layered blue artwork, and readable editorial layout. Find the waste in how the page reaches the reader.
On September 21, 2026, we measured the production site, made a focused set of delivery changes, and tested the result. This is a small implementation case study with the limits included, not a promise that the same changes produce the same numbers elsewhere.
Begin with the bottleneck, not the score
The initial homepage scored 96 on mobile and 100 on desktop in Lighthouse. That was already a good starting point. Mobile's largest contentful paint, or LCP, was about 2.6 seconds, however, and the report showed unnecessary image transfers.
LCP concerns when the largest qualifying visible image or text block renders. It is not the time when every resource on a page finishes loading. Google's guidance uses 2.5 seconds or less for good LCP at the 75th percentile of visits. A single lab run cannot establish that real-user result. Google's LCP guidance.
Two practical findings stood out. The server was delivering the site over HTTP/1.1, and the browser was downloading images larger than their visible use required. Those were specific things to investigate without changing the design.
Tell the browser how large the image really is
An image can have a small-looking box and still trigger a large download. Its source file, available variants, display size, and the screen's pixel density all affect the result.
On this homepage, the mobile artwork occupied a 280-by-210-pixel element, with the square artwork contained inside it. The visible image was therefore 210 pixels square. Its previous sizes hint described 280 pixels instead.
We corrected that hint and generated compressed variants of the existing artwork. In a three-times-density phone test, the browser then selected a 640-pixel source of roughly 45 KB rather than the earlier 800-pixel source of roughly 81 KB.
That is a narrow but useful distinction: we did not make the illustration smaller on the page. We made the download better match how it was displayed.
The workshop images and Labs screenshots also received responsive variants. Original images remained available, including the full-size illustrations linked from articles. Above-the-fold artwork kept high fetch priority; lower images kept lazy loading.
Improve delivery without changing the application
We enabled HTTP/2 on the marketing site's TLS listeners and increased gzip compression to level 6. HTTP/2 addresses how resources share a connection; compression reduces the bytes sent for suitable text resources. Neither requires a new visual design.
The application already served prerendered HTML. React ran during the build, rather than being shipped as a runtime requirement for reading an article. We kept that architecture and did not add a new optimization framework.
These changes were released together, so the measurements show their combined effect. We did not run an isolated experiment that assigns a precise number of milliseconds to HTTP/2, compression, or each image change.
Cache the things that have reliable identities
A long cache lifetime helps returning readers only if the browser can tell when a file has changed.
Generated image names now include a hash of their contents. The built CSS and JavaScript also have versioned names. Those files received a one-year cache lifetime. Mutable asset names retained a shorter policy; HTML did not receive the same long-lived treatment.
That split matters. A browser should reuse an unchanged image, but it should not remain stuck on an old article page because every response was given the same cache rule.
We also checked that the caching changes preserved the existing security headers and did not extend asset caching to the contact endpoint.
What the measurements showed
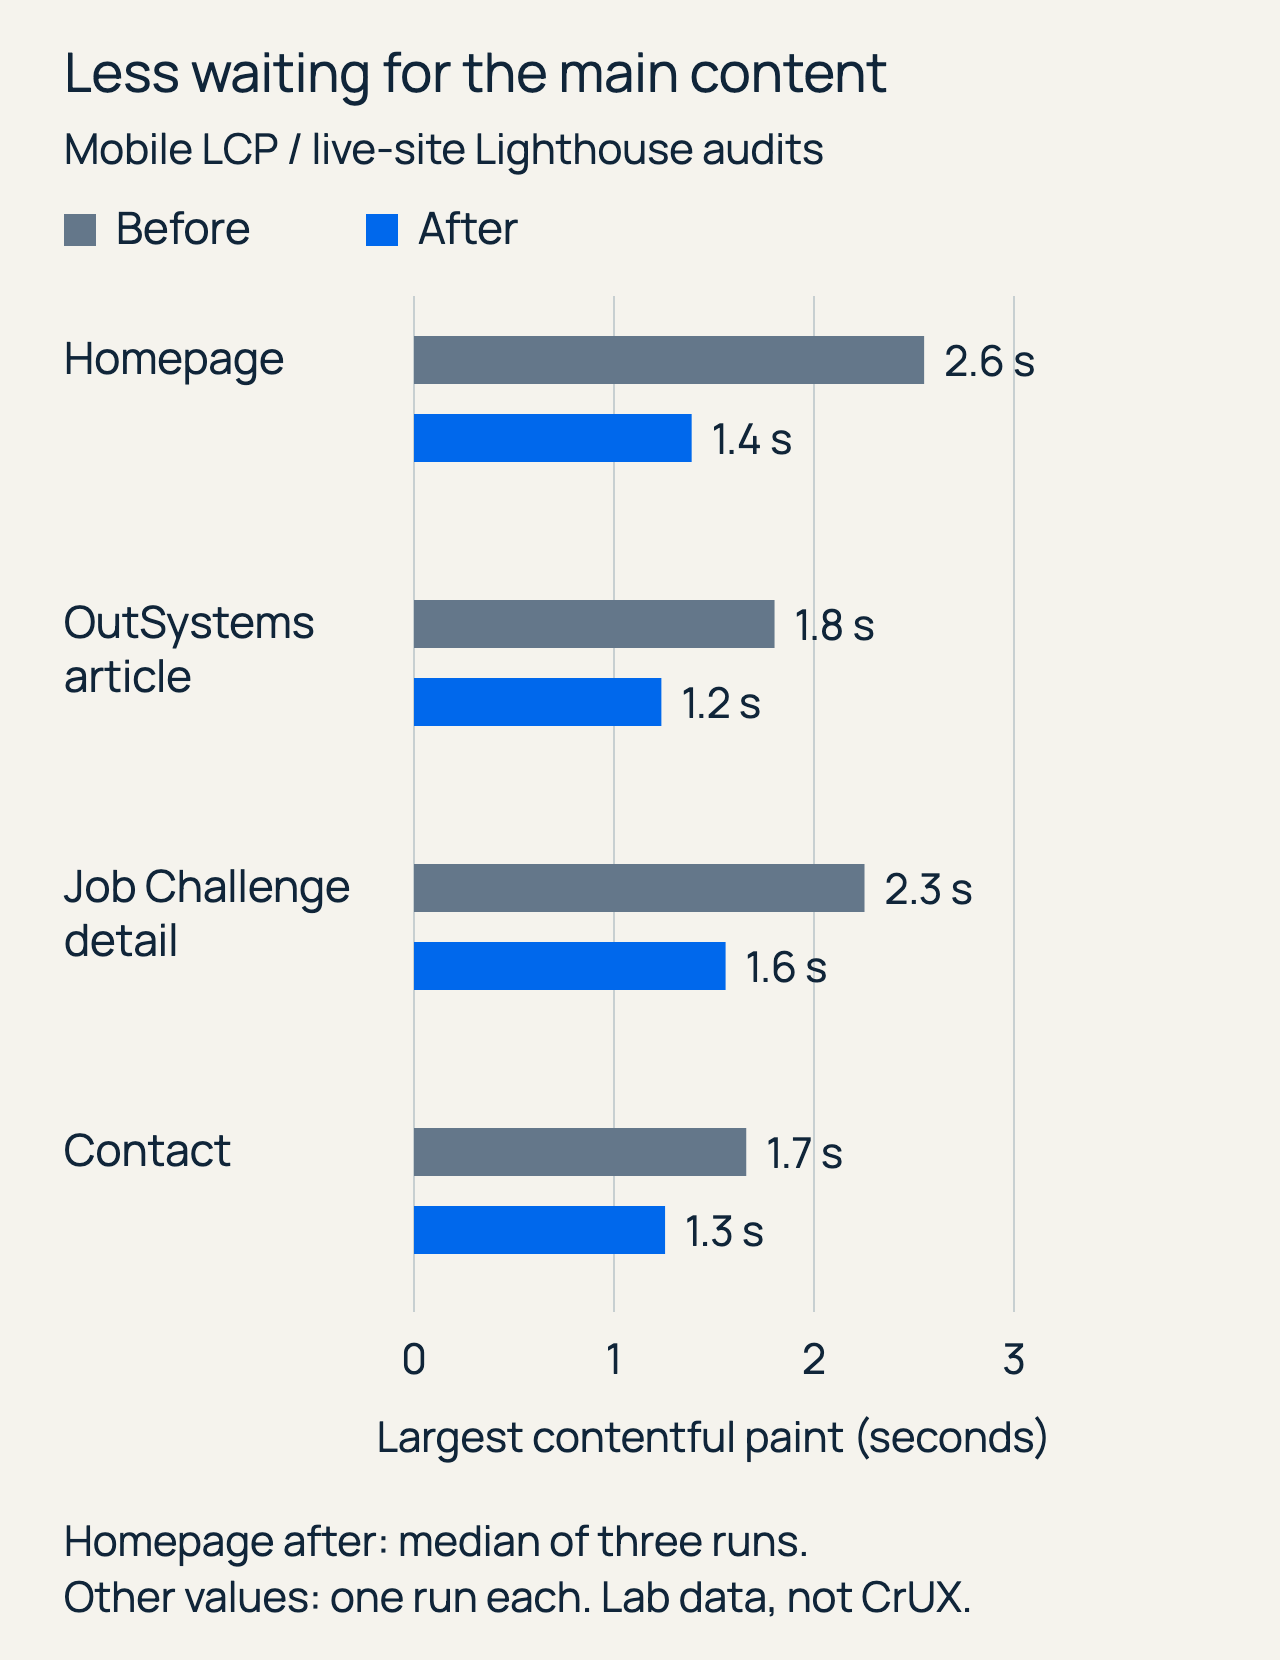
Mobile performance scores were 96 to 99 on the homepage, 98 to 99 on the OutSystems article, 97 to 100 on Job Challenge detail, and 100 before and after on Contact.
The homepage after-score is the median of three runs: 98, 99, and 100. Its LCP stayed around 1.4 seconds in all three. Other rows and baseline values are individual runs, not medians.
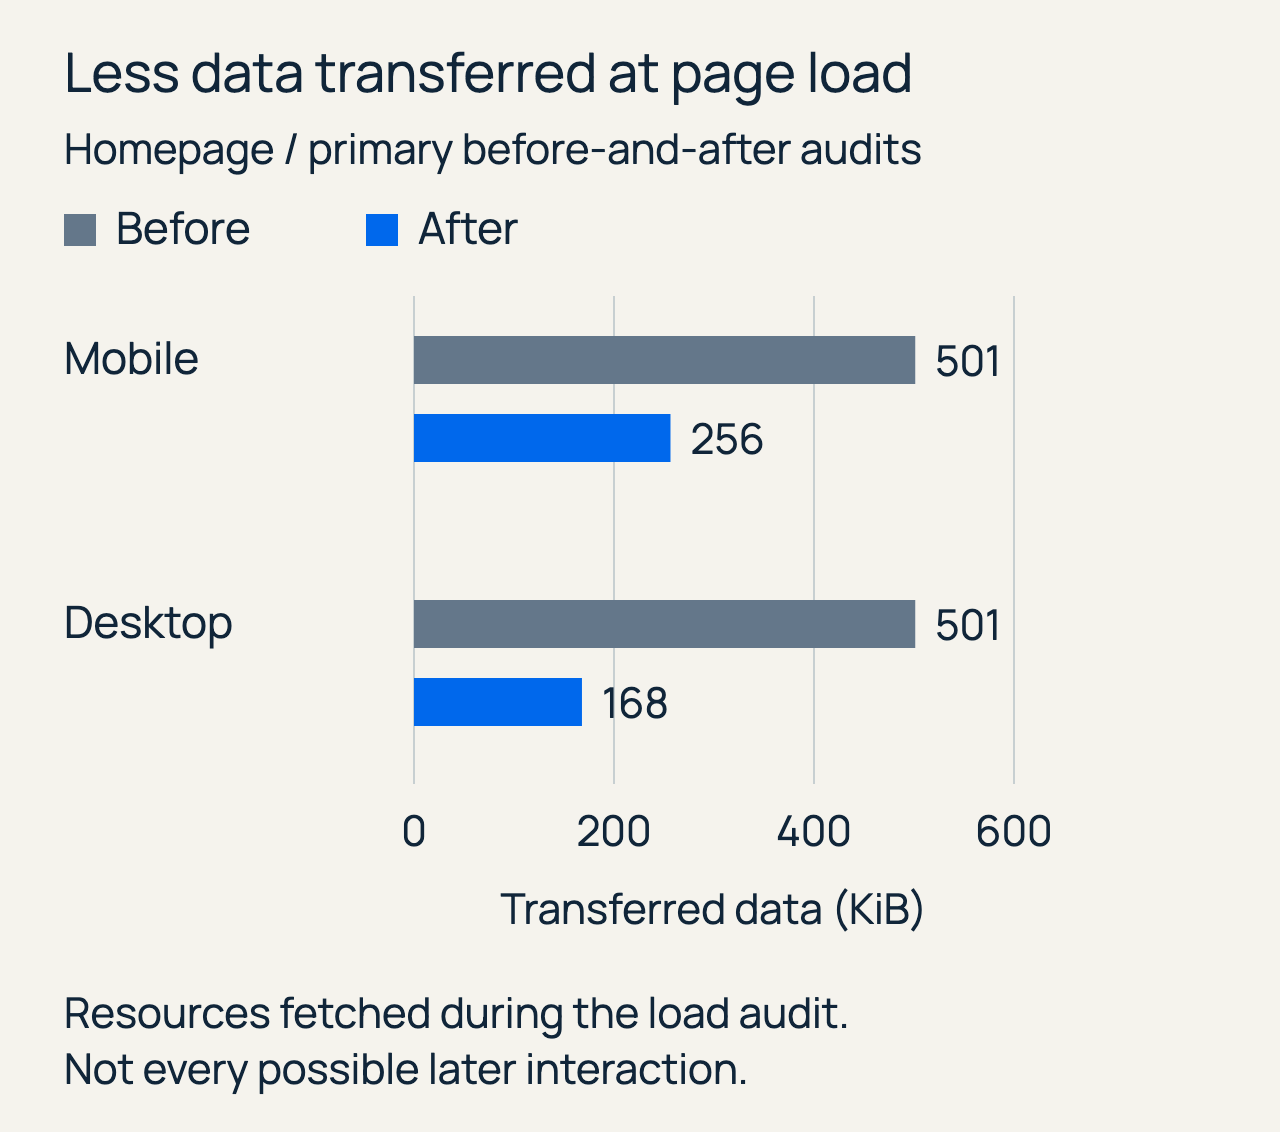
All four sampled pages scored 100 on desktop after the release. In the primary mobile homepage audit, observed transfer size fell from about 501 KiB to 256 KiB, roughly 49% less. That counts resources fetched during the audit's load observation, not every possible later interaction.
The audits measured zero cumulative layout shift and zero total blocking time. Those are useful results, but total blocking time is not a measurement of real-user interaction to next paint.
What we deliberately did not claim
These were Lighthouse 13.4.1 lab tests run serially from a Mac against the production site. Google's public PageSpeed Insights API was rate-limited, so these are not hosted PSI results. Lab and field measurements answer different questions. About PageSpeed Insights.
The tested first-visit state had not accepted optional analytics, and advertising was not serving on the parent site. Future ad placements and consented third-party scripts require their own measurement. We did not remove consent protections to improve a score.
Nor do faster pages establish AdSense eligibility. A speed test cannot assess whether an article contributes enough original value to readers.
Protect the improvement after the release
We ran the production build, a preview-server test, and all 70 desktop and mobile browser tests. Those checks covered navigation, search, privacy choices, contact-form behavior, links, and the new image rules. We also inspected both screen sizes visually.
A new regression test checks that a high-density phone selects the expected artwork variant and keeps that file below 50 KiB. The repository now includes an image-generation script and a repeatable audit command. That gives the next edit a measurable boundary instead of relying on someone remembering that performance work happened.
The lesson from this release is modest: before removing a visual element, check whether the reader is receiving an appropriately sized file over a sensible delivery path. In this case, better delivery left the design intact and made the main content appear sooner in the lab.
Inspect the measurements
Download the chart measurements: the plotted values and methodology notes. Raw reports and server configuration are not included. These are September 21 lab measurements, not real-user Core Web Vitals.
Share this article
Continue the conversation
A question, a different experience, or an idea for the next article? Send Jason a private response.